File:Excess energy graph red vs blue.JPG
Size of this preview: 800 × 513 pixels. Other resolutions: 320 × 205 pixels | 1,304 × 837 pixels.
Original file (1,304 × 837 pixels, file size: 63 KB, MIME type: image/jpeg)
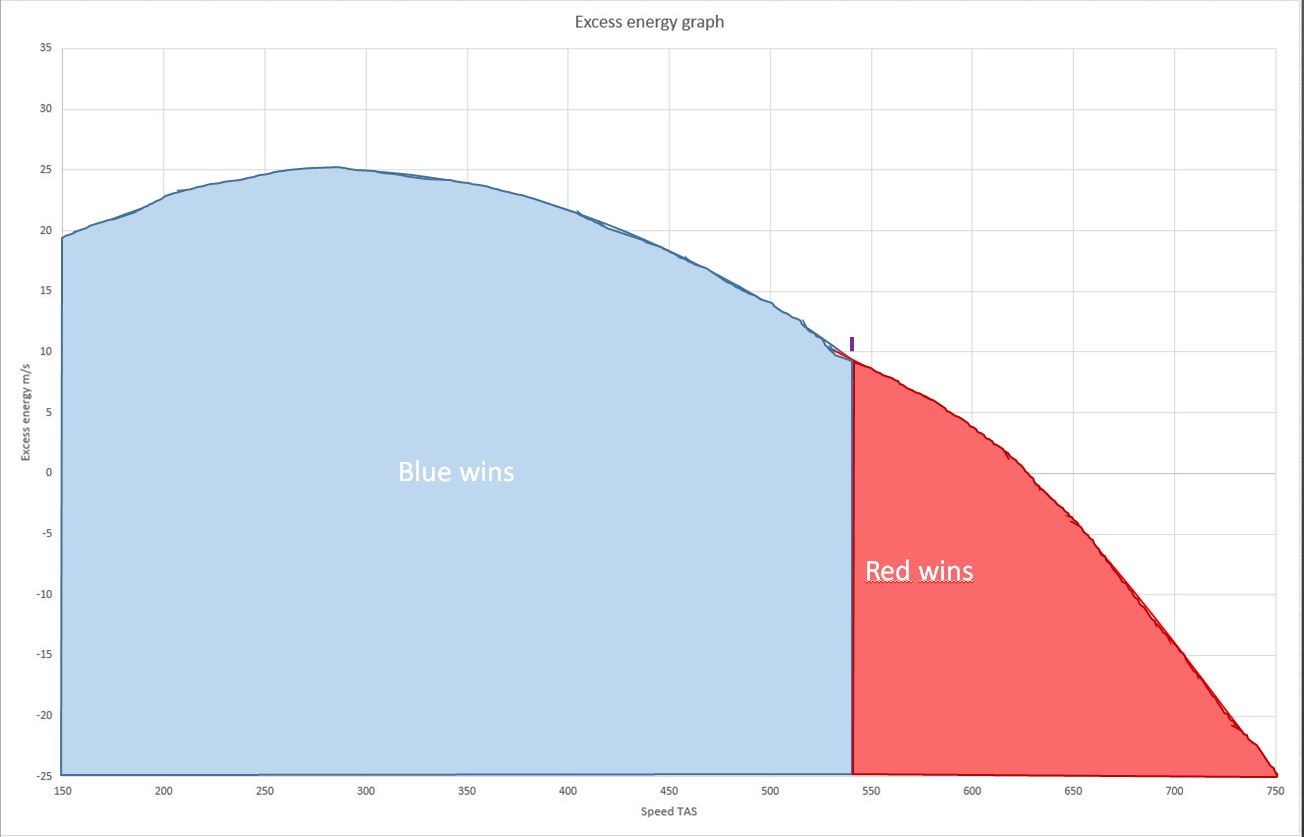
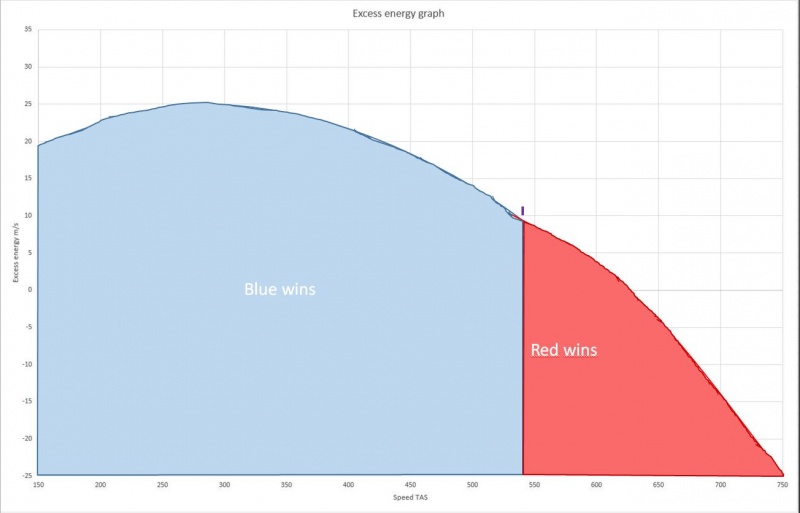
| Description | Excess Energy Diagram depicting areas where a blue and red aircraft have advantages. |
| Source | This is NOT representative or accurate to any aircraft in War Thunder - the sole purpose of this image is to provide a visual reference to a point being made in a wiki article. Image copied from https://forum.warthunder.com/index.php?/topic/376001-energy-fighting-explained-feedback-review-welcomed/ |
| Date | 04 January 2020 |
| Author | Rapitor |
File history
Click on a date/time to view the file as it appeared at that time.
| Date/Time | Thumbnail | Dimensions | User | Comment | |
|---|---|---|---|---|---|
| current | 23:20, 4 January 2020 | | 1,304 × 837 (63 KB) | AN_TRN_26 (talk | contribs) | {| class="wikitable" |- |Description || Excess Energy Diagram depicting areas where a blue and red aircraft have advantages. |- |Source || This is '''NOT''' representative or accurate to any aircraft in War Thunder - the sole purpose of this image is t... |
- You cannot overwrite this file.
File usage
There are no pages that link to this file.
